- To compare tornado "casualty” numbers during the hours of the day when most people are likely to be awake versus the hours of the day when most people are likely to be asleep.
- To describe any tornado casualty numbers’ differences across 11 states in the Southern region of the United States.
- To compare “tornado” appearances during the hours of the day when most people are likely to be awake versus the hours of the day when most people are likely to be asleep.
- To compare the number of appearances of each tornado strength classification and the number of casualties each may have caused during a specific time of the day.
Data Source
Data Analysis
Fatalities + Injuries = Casualties
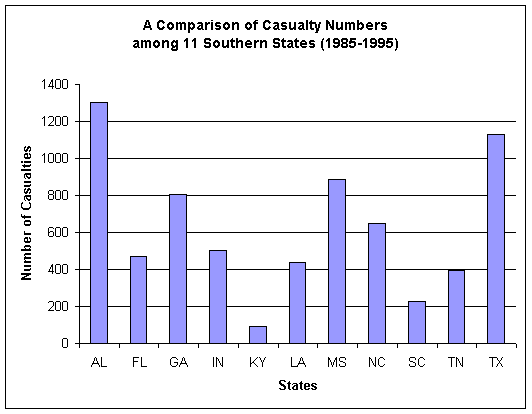
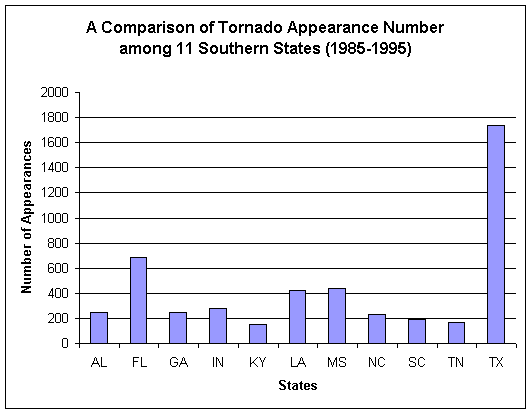
|
|
|
|
|
|
|
|
|
|
|
|
|
|
|
|
|
|
|
|
|
|
|
|
|
|
|
|
|
|
|
|
|
|
|
|
Clearly, between Alabama and Texas, there is something more to explore other than just describing the total casualties per year or per decade, because the numbers of casualties per 100 tornado appearances in both states are significantly different. Below, we attempted to understand when they mostly occured and when they actually caused the most casualties. Once the number of casualties per occurrence is calculated, we were then able to separate it into two different conditions:
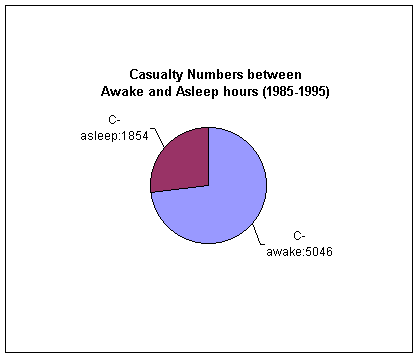
Now that we know most casualties occurred between 07:01 and 20:59 (awake hours), we felt that it was important also to know how many tornadoes actually appeared during that same period of the day.
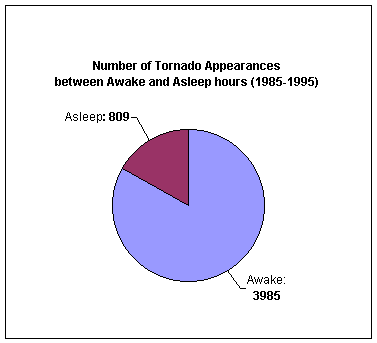
Using the information above, we can see how these two findings have a direct relationship with each other because the high number of casualties caused by tornadoes in the awake hours is proportional to high number of tornado appearances during the same period of the day. Thus, this relationship has led us to form this first hypothesis:
“Most tornadoes appeared between 07:01 and 20:59 (awake hours) and most tornado casualties also occurred during awake hours, thus, we assume that tornadoes that appeared during the day have been responsible for most of the tornado casualties.”
To confirm the validity of the above hypothesis we attempted to find a relationship between the appearances of each F-scale and the number of casualties that is caused by each F-scale. The number of appearances of each tornado strength classification (also known as F-scale) and the number of casualties each F-scale caused can be best described by the following graphs:
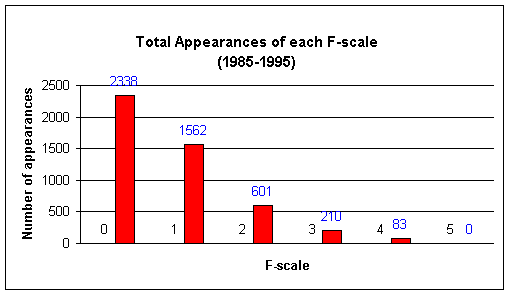
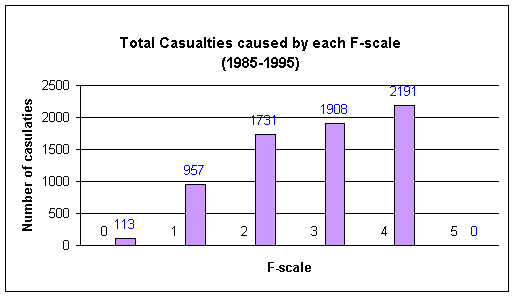
From
the graphs above we can conclude that, even though tornadoes with F-scales
3 and 4 did not appear very often, they have
caused significantly much greater number of casualties compared to the ones with lower
F-scales. To help quantify
the number of casualties each F-scale could cause, the table below projects
the possibility of the number of casualties for every 100 appearances of
each F-scale:
|
F-scale
|
|
|
|
|
|
|
|
|
|
|
|
|
|
|
|
|
|
|
|
A linear relationship does not exist between the F-scale and the number of casualties, but we do know that there is much greater safety risk involved when the F-scale reaches 3 and 4. Thus, this relationship has led us to form the second hypothesis:
“The higher the F-scale a tornado has, the higher the number of casualties.”
To relate to our findings earlier regarding the time of the day when most casualties occurred, we also analyzed the data to find the number of times each tornado with a specific F-scale appeared during the awake hours and summarized them as follows:
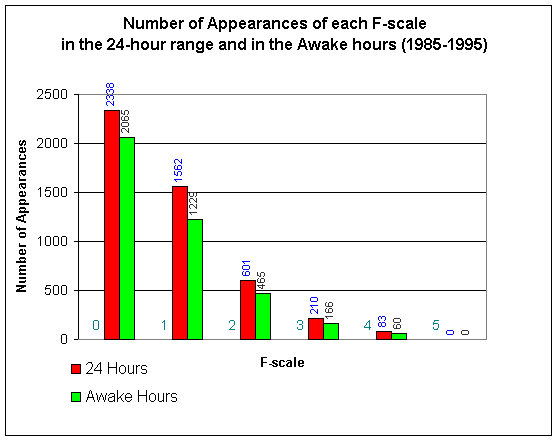
Our finding above shows that most of them actually did appear during the awake hours and thus enabled us to form the third hypothesis:
“Most
tornadoes that appeared between 07:01 and 20:59 (awake hours) with an F-scale
of 3 or higher have been responsible for most of the tornado casualties.”
Recommendation
* Link to MS Excel spreadsheet file in a WinZIP self-extracting format: tornado-work2.exe
© 2001 Indradi Soemardjan http://masindi.tripod.com Email: indi@mem.net