by Indradi Soemardjan - December 7, 2000
“Ibro exists to be the best Indonesian manufacturer of exotic coconut palm wood products for architectural and household uses. Our major strength lies in the ability to design with form-follows-function philosophy to satisfy our customer needs and in our cost effective mass production means and methods. We strive to provide the above average export quality for Southeast Asian and North American markets and to be the best among Indonesian furniture manufacturers in our specific product categories.”
Indonesia, the fourth most populous nation on earth, is currently experiencing one of the worst economic difficulties it has ever had since two decades ago. Its socio-economic situation is similar to what happened in the United States more than a century and a half ago; where the actual meaning of democracy was still in question.
As a result of many political battles among the country leaders, dozens of its great economic players have suffered financial losses and many foreign investors also have left the country. Formerly known as the Asian Tiger, this country, at the moment, is in a desperate need of an “awakening”.
In this post-Suharto era, referred to by public as the Era of Reform, many large businesses have failed to regain their success as Asian Tigers. The only ones left to survive are the businesses that are not dependent upon imported resources, such as paper and chemical industries. Businesses that locally manufacture goods can sell them abroad with more competitive prices are now accumulating wealth as a result of the downfall of Indonesian currency (Rupiah) relative to the US Dollars.
It is now time for Indonesian entrepreneurs and investors to turn the “undesirable situation” into an “opportunity” for success. So long as the idea is to create any kind of unique product that does not require imported raw materials and can be exported, the business is determined to survive current economic situation and hopefully will continue to prosper; provided that sales revenues be in US Dollars for it is now worth four times it was two years ago relative to the local currency.
The idea of Marketing Coconut Wood based products came as a result of the need to capture an international niche market. Every year among Indonesian islands, there are at least 3 million coconut trees that became unproductive due to natural aging and are cut down as lumber. Despite of its difficulty to process and produce as consumer goods, many foreign consumers have admired the beauty of its grain and its natural resistance to termites, thus, allowing an opportunity to capture a small but important segment.
This business plan is the “game plan” that we have for positioning our company, Ibro, in our chosen market segment, competing successfully, pleasing customers and achieving good business. Below is what we have come up with that best describes our existence:
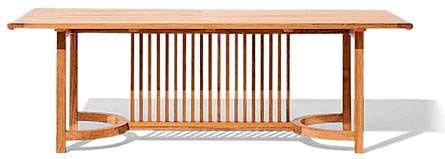
Given the distinctive attributes of coconut palm wood, such as it’s unique natural grain pattern and its exceptional hardness as compared to most of the commonly used hardwood species, we plan to enter the international architectural wood flooring and furniture markets by adopting a market niche strategy on differentiation: using the notion of “exotic tropical wood products” to position our products in order to compete with the prevailing premium prices. Our low labor and infrastructure costs will allow us to sell our products at about 20 percent lower than the prices offered by the major competitors. We noticed that the United States’ west coast region consists of people with high appreciation of such products that can afford having exotic wood products in their homes. As a benchmark, we have used some data from Smith & Hawken, a California-based distributor of teak wood furniture, to determine our pricing strategy. Below is a general price comparison between our prices and those of the other premium products made of other exotic wood (teak, mahogany, et cetera):
|
Product
Type |
Our
COGS |
Competitors'
Price |
Our
Price |
Our
Profit Margin |
|
|
|
|
|
|
|
Simple Pattern 12"x12" Tile |
$1.38 |
$8.00 |
$6.00 |
435% |
|
|
per
sq. ft. |
|
|
|
|
|
|
|
|
|
|
Deluxe Pattern 12"x12" Tile |
$1.54 |
$9.00 |
$7.00 |
455% |
|
|
per
sq. ft. |
|
|
|
|
|
|
|
|
|
|
Dining Armchair |
$74.40 |
$350.00 |
$280.00 |
376% |
|
|
per
chair |
|
|
|
|
|
|
|
|
|
|
Dining Chair |
$65.20 |
$280.00 |
$220.00 |
337% |
|
|
per
chair |
|
|
|
|
|
|
|
|
|
|
Garden Bench |
$156.00 |
$600.00 |
$480.00 |
308% |
|
|
Per
bench |
|
|
|
|
|
|
|
|
|
|
Dining Table |
$234.75 |
$1,150.00 |
$920.00 |
392% |
|
|
per
table |
|
|
|
In
terms of communicating our ideas, we have personal selling ideas in mind. This
method has been widely used by Indonesian manufacturer and we will utilize this
method as our major tool to sell our products; to be done using our internal
staff agents. Our main channel of distribution will consist primarily of current
foreign wholesalers in the targeted countries such as Hong Kong, Taiwan and of
several prospective wholesalers and distributors the United States. In short, we
will mainly adopt a combination of “indirect” and “cooperative”
exporting methods to reduce potential risks while allowing us to have a
flexibility to grow and form mutual partnerships with prospective distributors
abroad.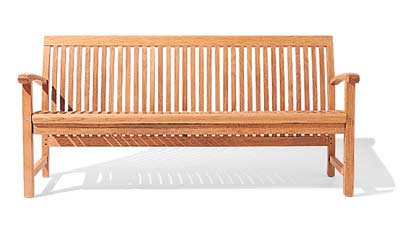
In the United States, we have begun to search for prospective distributors. Memphis Imports Company, a Memphis-based distributor of many different types of products imported from Southeast Asia, has expressed their interested to buy our coconut palm wood products as early as 2001. Precision Flooring Services in Oregon has also shown their interest to purchase our coconut palm wood tile flooring to expand their wide selection of wood flooring products.
In the long run, we want to maintain the same distribution plan along with some expansion ideas to accommodate growth for our company. To further increase our revenue in the next two or three years, we have also considered becoming a vendor for The Home Depot. One major hindrance factor lies in our production output capacity; currently, it has not been large enough to satisfy the minimum requirement that its Atlanta headquarters had stated in their publication.
The top 50 furniture-producing countries provide almost 100% of the world furniture production. There are great differences in productive capacity and purchasing power between developed countries, which claim 79% of total furniture production, and developing ones.
There is an increasing degree of openness in the furniture sector worldwide. The growth in world furniture trade, has two determinants: the increasing openness of the markets, which enables competitive companies to develop their turnover even when faced with a stagnant market, and the growth in world consumption, which has also affected the developing countries since the mid-80's, with the emergence of hundreds of millions of consumers with similar levels of spending to western ones, who are also tending to assume western consumption models and tastes. Developing countries are therefore potential customers for middle and upper-middle range furniture produced in the west.
Seven countries in South East Asia (Philippines, Indonesia, Malaysia, Singapore, Thailand), Korea and Taiwan have a combined furniture production of about US$ 14,500 million, with Korea and Taiwan being the largest furniture markets and the main furniture consumers in the area.
The seven countries all show a common feature: the furniture sector is considered to be a strategic one and benefits from measures that have fostered its development. Such an industrial policy has meant that the furniture industry has developed quickly due to the low cost of labor and raw materials and to the increasing purchasing power of the population. In recent years most of these countries have witnessed growth in demand for kitchen furniture, beds, wardrobes (typical segments of a western life-style); they also have a well-developed presence in the office seating and furniture segments both in Asia and in the West. The per capita consumption of furniture varies from country to country as well as the degree and kind of openness towards international trade in the furniture sector.
 Parquet has
again become fashionable and this is changing the wood flooring industry. Mainly
due to the increasing success of multi-layer flooring and to the growing
consumption of wood floors, a process of company aggregation is underway which
will lead to further changes in the wood flooring industry. The increasing
control of wood flooring distribution by large chains has also contributed to
the rationalization of parquet producers. The report provides wood flooring
production and consumption breakdown by country and by type (multi-layer, solid
parquet, lamparquet, mosaic); production and product mix of the main wood
flooring manufacturers. In the United States, solid wood pre-finished floors
claim a considerable share of the market, while in Europe solid wood
pre-finished floors occupy only a marginal position. Overall, the consumption
and production of solid wood flooring in the 5 countries is holding up, despite
the increase in multi-layer floor coverings.
Parquet has
again become fashionable and this is changing the wood flooring industry. Mainly
due to the increasing success of multi-layer flooring and to the growing
consumption of wood floors, a process of company aggregation is underway which
will lead to further changes in the wood flooring industry. The increasing
control of wood flooring distribution by large chains has also contributed to
the rationalization of parquet producers. The report provides wood flooring
production and consumption breakdown by country and by type (multi-layer, solid
parquet, lamparquet, mosaic); production and product mix of the main wood
flooring manufacturers. In the United States, solid wood pre-finished floors
claim a considerable share of the market, while in Europe solid wood
pre-finished floors occupy only a marginal position. Overall, the consumption
and production of solid wood flooring in the 5 countries is holding up, despite
the increase in multi-layer floor coverings.
The furniture in Indonesia is mainly exported to USA, Japan and Europe. The competitors encountered are in general the same and the strongest include Italy, China, Malaysia and Taiwan. However, for the European market, in addition to Italy, Indonesian manufacturers should give a closer watch on the development of east European nations, mainly Poland. The competing advantages of each nation are analyzed as follows:
Italy still tops the ranking of the world’s first twenty export nations of furniture. Its total export amount of furniture already attained US$8.3 billion and 66 million in 1995. Manufacturers in Indonesia should give a close watch on its performance in the world’s largest import market of furniture, USA.
Italian
furniture has always features in its design. Its popularity in the international
markets is really unmatched. It is clearly shown in the grandeur on the first
day of Milan International Furniture Fair each year, when there are usually
dozens of Indonesian furniture importers lining up to fight for agency. The GNP
of Italy in 1995 was US$19,220, but the prices of its products are merely 20 to
30% higher in the international markets. The main factor to this phenomenon is
the process automation is to a fairly high extent in the furniture industry in
Italy. The products of Italy not only are competitive in prices, but also have
their own uniqueness for the product design in terms of function, style and
quality. Thus, it leads to the continuous growth in the export amount of
furniture from Italy. It is really the target from whom exporters in Indonesia
should learn. Moreover, the furniture industry in Indonesia should also develop
in the same direction.
The one with
the most dazzling growth rate among the world’s first twenty export nations of
furniture is Poland. Its growth rate reached up to 49% in 1995. And its world
ranking boosted all the way from the 19th place in 1993, the 12th in 1994 and
one place higher in 1995 to the 11th. The export of Poland has increased in
recent years following the open market and the revival of economic situations.
Further due to Germany intentionally bringing up the economic prosperity in east
Europe, 400 furniture factories at various scales have been built in the east
part of Germany and Poland in the last three years. Thanks to its geographic
position, Poland has teamed up with Germany for mutual supports and benefits.
Poland uses Germany’s existing marketing channels to distribute products to
other west European nations. We cannot neglect its potential, as it can possibly
become a strong rival to Indonesia. Hence, manufacturers in Indonesia should
give a close watch on its development.
China’s
performance is also very laudable. In 1995 the export amount of furniture
already attained US$1.8 billion. The ranking in 1994 boosted from the 9th to the
7th. Its success in the American market is also worth manufacturers in Indonesia
to contemplate. By end of September 1998, it forced Canada off the throne and
became USA’s largest nation of import source. And its export amount grew from
US$912 million in the same period of the previous year to US$1.3 billion and 8.2
million, the growth rate up to 44%.
Another
nation worth noting is Malaysia. Following the progress of other Asia nations,
it evolved from the 21st to the 15th within three years. Malaysia is one of the
main supply nations of lumber. In recent years, the Malaysian government has
prohibited the export of rattan and pulpwood in order to support the downstream
manufacturers of lumber industry and protect tropical rainforests. It has made
restrictions on quantity and quota for rattan furniture and processed wooden
products, in addition to charging export duties. Malaysian furniture
manufacturers, with the advantages of abundant resource of lumber, low wages and
people able to communicate in English, have dominated the international markets
recently and their performance is also very laudable. Though the result 1998 was
not so satisfactory and the amount of exported furniture to USA saw a negative
growth of 4%, the subsequent stance of Malaysia is still promising with its
existing advantages.
Among the world’s first twenty export nations of furniture, Indonesia was also one of those with continuous growth for the last few years. It was the world’s largest source of rattan. However, as the Indonesian government is promoting the development of non-petroleum manufacturers and strengthening the export industry, export of raw materials like pulpwood and rattan have been prohibited and lumber is only allowed for export after being processed to certain extent. These measures have already worked. The growth rate of export amount in 1995 was 10%. The amount increased from us$715 million in 1994 to US$817 million. 1994 also saw the growth of 16%. When the export amount was merely US$176 million in 1993, Indonesia already took the 17th place in the ranking of the world’s first twenty export nations of furniture. Unfortunately, the smog disaster in 1997 and the financial turbulence in Southeast Asia caused great damages. To make the matter worse, the continuous anti-Chinese movement since 1998 and frequent riots at the present have led to the depression in various industries. It is hard to predict its subsequent development.
In recent years, the Indonesian economic depression has led to rising material prices. Under the stimulation of various unfavorable factors, furniture manufacturers in Indonesia are forced to take the temporary measure of shipping lumber back to suppliers after initial processing and exporting. Despite years of efforts, the export amount of furniture from Indonesia remained sluggish last year. To overcome the challenges in the unfavorable domestic and international markets and strengthen the competitiveness of furniture industry in Indonesia, manufacturers should enhance the improvement of manufacturing processes, elevate the level of process automation as well as refinement of labor division and team work systems, to reduce costs.
In addition to strengthening competitiveness in the international markets, the manufacturers also must double efforts to search for strategies for elements of production upgrading like development of new products, control of marketing channels and exchange of industrial information. Moreover, they must invest in the development of forestation in other nations to ensure the acquisition of pulpwood and follow the global trend of environmental protection. Thus, they can keep the mature production techniques in Indonesia.
|
Indonesian Export Data |
|
|
|
|
|
|
1994-1998 |
(in thousands of US$) |
|
|
|
|
|
|
|
|
|
|
|
|
Commodity Type |
1994 |
1995 |
1996 |
1997 |
1998 |
|
|
|
|
|
|
|
|
Crude Oil |
5,071,565 |
5,145,704 |
5,711,811 |
5,479,991 |
3,348,625 |
|
Oil Based Products |
932,923 |
129,674 |
151,609 |
1,302,451 |
708,072 |
|
Natural Gas |
3,689,124 |
4,021,971 |
4,493,915 |
4,840,107 |
3,815,466 |
|
|
|
|
|
|
|
|
Agriculture |
2,818,331 |
2,887,324 |
2,920,424 |
3,274,861 |
3,658,888 |
|
Manufacturing |
25,702,671 |
29,329,389 |
32,116,994 |
34,842,986 |
34,587,685 |
|
Mining |
1,837,113 |
2,735,304 |
3,054,216 |
3,170,546 |
2,724,449 |
|
Others |
171 |
1,553 |
1,304 |
5,326 |
4,454 |
|
|
|
|
|
|
|
|
Total |
40,051,898 |
44,250,919 |
48,450,273 |
52,916,268 |
48,847,639 |
|
|
|
|
|
|
|
|
Source : BPS, generated by Pusdata Dep. Perindustrian dan Perdagangan |
|
|
|||
|
Indonesian Balance of Trade |
|
|
|
September 1, 2000 |
(in millions of US$) |
|
|
|
|
|
|
Data Component |
Latest Data |
Latest Data-1 |
|
Total Exports |
5,342 |
6,229 |
|
Total Imports |
3,102 |
4,360 |
|
Balance of Trade |
2,240 |
1,869 |
|
|
|
|
|
Source: International Monetary Fund's Dissemination Standards Bulletin
Board (DSBB) |
||
|
Indonesian Foreign Trade |
|
|
|
|
|
1990-1999 |
(in millions of US$) |
|
|
|
|
|
|
|
|
|
|
Year |
Including
oil and gas |
Excluding
oil and gas |
||
|
|
Export |
Import |
Export |
Import |
|
1990 |
25,675.30 |
21,837.10 |
14,604.20 |
19,916.60 |
|
1991 |
29,142.40 |
25,868.80 |
18,247.50 |
23,558.60 |
|
1992 |
33,967.00 |
27,279.60 |
23,296.10 |
25,164.50 |
|
1993 |
36,823.00 |
28,327.80 |
27,077.20 |
26,157.30 |
|
1994 |
40,053.40 |
31,983.50 |
30,359.80 |
29,616.10 |
|
1995 |
45,418.00 |
40,628.70 |
34,953.60 |
37,717.90 |
|
1996 |
49,814.80 |
42,928.50 |
38,092.90 |
39,333.00 |
|
1997 |
53,443.60 |
41,679.80 |
41,821.00 |
37,755.70 |
|
1998 |
48,847.60 |
27,336.90 |
40,975.40 |
24,683.20 |
|
1999 |
48,665.50 |
24,003.30 |
38,873.20 |
20,322.20 |
|
|
|
|
|
|
|
Source : BPS, generated by Pusdata Dep. Perindustrian dan Perdagangan |
|
|||
|
Indonesian Value and Growth of Foreign Trade with Main Partner
Countries |
||||||
|
1998/1999 |
(in millions of US$) |
|
|
|
|
|
|
|
|
|
|
|
|
|
|
Partner
Country |
1998 |
1999 |
Growth
(%) |
|||
|
|
Export |
Import |
Export |
Import |
Export |
Import |
|
ASIA |
|
|||||
|
1. Japan |
9,116.00 |
4,292.50 |
10,397.20 |
2,913.30 |
14.05 |
-32.13 |
|
2. Singapore |
5,718.30 |
2,542.80 |
4,930.50 |
2,525.90 |
-13.78 |
-0.66 |
|
3. Republic of Korea |
2,567.80 |
1,527.80 |
3,319.80 |
1,330.10 |
29.29 |
-12.94 |
|
4. Taiwan |
1,720.70 |
994.6 |
1,757.50 |
784.1 |
2.14 |
-21.16 |
|
5. China |
1,832.00 |
906.3 |
2,008.90 |
1,242.10 |
9.66 |
37.05 |
|
6. Hongkong |
1,865.00 |
263.7 |
1,330.00 |
227.5 |
-28.69 |
-13.73 |
|
EUROPE |
|
|||||
|
1. Germany |
1,401.30 |
2,365.7 |
1,233.90 |
1,398.50 |
-11.95 |
-40.88 |
|
2. Netherlands |
1,512.30 |
338.4 |
1,543.60 |
346.7 |
2.07 |
2.45 |
|
3. United Kingdom |
1,143.10 |
920.3 |
1,176.10 |
511.2 |
2.89 |
-44.45 |
|
4. France |
547.3 |
568.1 |
503.2 |
371.6 |
-8.06 |
-34.59 |
|
5. Italy |
858.8 |
480.4 |
655.5 |
276.9 |
-23.67 |
-42.36 |
|
AMERICA |
|
|||||
|
1. USA |
7,031.00 |
3,517.3 |
6,896.50 |
2,839.00 |
-1.91 |
-19.28 |
|
2. Canada |
411.7 |
504.2 |
353.5 |
421.2 |
-14.14 |
-16.46 |
|
AUSTRALIA & OCEANIA |
|
|||||
|
1. Australia |
1,533.50 |
1,760.50 |
1,484.80 |
1,460.40 |
-3.18 |
-17.05 |
|
2. New Zealand |
103.9 |
142.9 |
108.5 |
110 |
4.43 |
-23.02 |
|
|
|
|
|
|
|
|
|
Source : BPS, generated by Pusdata Dep. Perindustrian dan Perdagangan |
|
|
||||
|
Indonesian Exports by Economic Country Groups |
|
|
|||
|
1998/1999 |
(in millions of US$) |
|
|
|
|
|
|
|
|
|
|
|
|
Economic
Group |
1998 |
1999 |
Changes |
Growth
(%) |
Contribution
(%) |
|
*APEC : |
35,691.6 |
36,145.5 |
449.6 |
1.3 |
74.1 |
|
- ASEAN |
9,177.6 |
8,202.2 |
-979.9 |
-10.8 |
16.7 |
|
Malaysia |
1,358.5 |
1,335.9 |
-22.5 |
-1.7 |
2.7 |
|
Philippines |
707.4 |
694.7 |
-12.7 |
-1.8 |
1.4 |
|
Singapore |
5,718.3 |
4,930.5 |
-787.8 |
-13.8 |
10.1 |
|
Thailand |
942.5 |
812.7 |
-129.8 |
-13.8 |
1.7 |
|
Brunai Darusalam |
35.7 |
27.6 |
-8.0 |
-22.5 |
0.1 |
|
Vietnam |
350.6 |
331.6 |
-19.0 |
-5.4 |
0.7 |
|
Kamboja |
64.7 |
69.2 |
4.5 |
6.9 |
0.1 |
|
- NAFTA |
7,656.6 |
7,429.6 |
-227.0 |
-3.0 |
15.3 |
|
USA |
7,031.0 |
6,896.5 |
-134.5 |
-1.9 |
14.2 |
|
Canada |
411.7 |
353.5 |
-58.2 |
-14.1 |
0.7 |
|
Mexico |
213.9 |
179.6 |
-34.3 |
-16.0 |
0.4 |
|
- OTHERS |
18,857.4 |
20,513.7 |
1,656.3 |
8.8 |
42.1 |
|
Taiwan |
1,720.7 |
1,757.5 |
36.8 |
2.1 |
3.6 |
|
Japan |
9,116.0 |
10,397.2 |
1,201.2 |
14.1 |
21.4 |
|
Hongkong |
1,865.0 |
1,330.0 |
-535.0 |
-28.7 |
2.7 |
|
Rep. of Korea |
2,567.8 |
3,319.8 |
752.0 |
29.3 |
6.8 |
|
Peop. Rep. of China |
1,832.0 |
2,008.9 |
176.9 |
9.7 |
4.1 |
|
Chile |
88.9 |
73.6 |
-15.3 |
-17.2 |
0.2 |
|
Australia |
1,533.5 |
1,484.8 |
-48.6 |
-3.2 |
3.0 |
|
New Zealand |
103.9 |
108.5 |
4.6 |
4.4 |
0.2 |
|
Papua New Guinea |
29.6 |
33.4 |
3.8 |
12.7 |
0.1 |
|
Economic
Group |
1998 |
1999 |
Changes |
Growth
(%) |
Contribution
(%) |
|
*EU |
7,765.8 |
7,085.00 |
-680.8 |
-8.8 |
14.6 |
|
United Kingdom |
1,143.1 |
1,176.10 |
32.9 |
2.9 |
2.4 |
|
Netherlands |
1,512.3 |
1,543.60 |
31.3 |
2.1 |
3.2 |
|
R. F. Germany |
1,401.3 |
1,233.90 |
-167.4 |
-11.9 |
2.5 |
|
Belgium & Luxembourg |
876.5 |
696.5 |
-180.0 |
-20.5 |
1.4 |
|
France |
547.3 |
503.2 |
-44.1 |
-8.1 |
1.1 |
|
Denmark |
143.2 |
141.9 |
-1.3 |
-0.9 |
2.9 |
|
Ireland |
48.0 |
41.6 |
-6.4 |
-13.4 |
0.1 |
|
Italy |
858.8 |
655.5 |
-203.2 |
-23.7 |
1.8 |
|
Greece |
108.1 |
96.9 |
-11.2 |
-10.4 |
0.2 |
|
Portugal |
36.8 |
39.6 |
2.9 |
7.6 |
0.1 |
|
Spain |
868.7 |
741.6 |
-127.1 |
-14.6 |
1.8 |
|
Austria |
39.5 |
20.3 |
-19.2 |
-48.6 |
0.1 |
|
Sweden |
74.0 |
81.2 |
7.2 |
9.7 |
0.2 |
|
Finland |
108.1 |
113.1 |
5.0 |
4.6 |
0.2 |
|
|
|
|
|
|
|
|
*MIDDLE EAST |
1,815.5 |
1,744.0 |
-71.6 |
-3.9 |
3.6 |
|
|
|
|
|
|
|
|
*OTHERS |
3,574.7 |
3,690.9 |
120.6 |
3.3 |
7.7 |
|
|
|
|
|
|
|
|
TOTAL |
48,847.6 |
48,665.40 |
-182.2 |
-0.4 |
100.0 |
|
|
|
|
|
|
|
|
Source : BPS, generated by Pusdata Dep. Perindustrian dan Perdagangan |
|
||||
 Our biggest
investment has been in plant and equipment installation; a 5,000 square-foot
solar drying kiln and a 10,000 square-feet wood working shop in the outskirt of
Jakarta. We have just recently purchased several pre-owned wood cutting
machinery made in China and the Netherlands. Also, we have been working on our
product development phase since early 2000; investing so much of our resources
into quality improvement research. Our main focus in this research is to
understand the properties of this wood species so that we can control its
moisture content with a greater confidence level; we found that the climatic
difference between continents has created some noticeable irregularities in
final finished products - such as cracking and bowing on the finished wood
surfaces. In short, one of our main objectives at the moment is to have plant
and equipment ready as soon as we have discovered the best method to eliminate
the moisture content problem.
Our biggest
investment has been in plant and equipment installation; a 5,000 square-foot
solar drying kiln and a 10,000 square-feet wood working shop in the outskirt of
Jakarta. We have just recently purchased several pre-owned wood cutting
machinery made in China and the Netherlands. Also, we have been working on our
product development phase since early 2000; investing so much of our resources
into quality improvement research. Our main focus in this research is to
understand the properties of this wood species so that we can control its
moisture content with a greater confidence level; we found that the climatic
difference between continents has created some noticeable irregularities in
final finished products - such as cracking and bowing on the finished wood
surfaces. In short, one of our main objectives at the moment is to have plant
and equipment ready as soon as we have discovered the best method to eliminate
the moisture content problem.
Based on last year’s domestic and international sales (to a few Asian markets) and using a method of analogy, we have predicted our sales in the United States as follows:
|
Product Type |
Quantity
Sold |
Unit |
Price/Unit |
Revenue |
|
Simple Pattern |
15,000 |
s.f. |
$6.00 |
$90,000.00 |
|
Deluxe Pattern |
15,000 |
s.f. |
$7.00 |
$105,000.00 |
|
Dining Armchair |
500 |
ea. |
$280.00 |
$140,000.00 |
|
Dining Chair |
500 |
ea. |
$220.00 |
$110,000.00 |
|
Garden Bench |
200 |
ea. |
$480.00 |
$96,000.00 |
|
Dining Table |
100 |
ea. |
$920.00 |
$92,000.00 |
|
|
|
|
|
|
|
Total |
|
|
|
$633,000.00 |
*Due to the high shipping cost, we estimated about 15,000 square feet of wood flooring, which will easily fit into one 40-foot long freight container. That quantity is enough to provide flooring for about 10-12 luxury homes in California in one year. The rest of the numbers have been estimated to match our plant output capacity.
Using the corresponding production data forecast and an estimate of all of the other relevant costs, we have generated our company’s ProForma as follows:
PRO FORMA
|
|
|
|
|
|
|
|
|
|
|
|
Total Sales Revenue |
$633,000 |
|
|
|
|
|
|
Variable Costs |
|
|
|
|
Manufacturing Cost |
$129,900 |
|
|
Shipping and Tariffs |
$38,375 |
|
|
|
|
|
Gross Margin |
$464,725 |
|
|
|
|
|
|
Fixed Costs |
|
|
|
|
Building: depreciation expense |
$12,500 |
|
|
Equipment: depreciation expense |
$20,000 |
|
|
Research and Development |
$3,000 |
|
|
Marketing Cost |
$36,000 |
|
|
Administrative Cost |
$60,000 |
|
|
Miscellaneous |
$12,000 |
|
|
|
|
Net Income
|
$321,225 |
|
*Building depreciation expense is derived from $250,000 construction depreciated over 20-year period.
*Equipment depreciation expense is derived from $100,000 purchase price depreciated over 5-year period.
*Marketing cost is derived from monthly expenses of
approximately $3000.
From the Pro Forma, we can see that if we could successfully market in the United States, we could achieve an abnormal net income of about 51 percent of our sales revenue.
“National Economic Survey 1997, 1998, and 1999” © 1996, Badan Pusat Statistik (Statistics Indonesia), Republic of Indonesia.
“Review and Prospects of the Furniture Industry” © 1999, China External Trade Development Council (CETRA), Taiwan.
“The Furniture Industry in Southeast Asia, Korea and Taiwan” © 1999, CSIL - Centro Studi Industria Leggera, Italy.
“Trade: Summer 2000 Catalog” © 2000, Smith & Hawken Trade, California.